Two AI bosses said slow down. The chart kept going.
On 12 September 2026, Anthropic’s chief executive Dario Amodei and OpenAI’s chief executive Sam Altman — two of the most powerful people building artificial intelligence — both said, in public, that the industry needs to slow down. Their worry: AI is moving too fast for anyone to keep it safe. Two days later, AI-linked stocks fell.
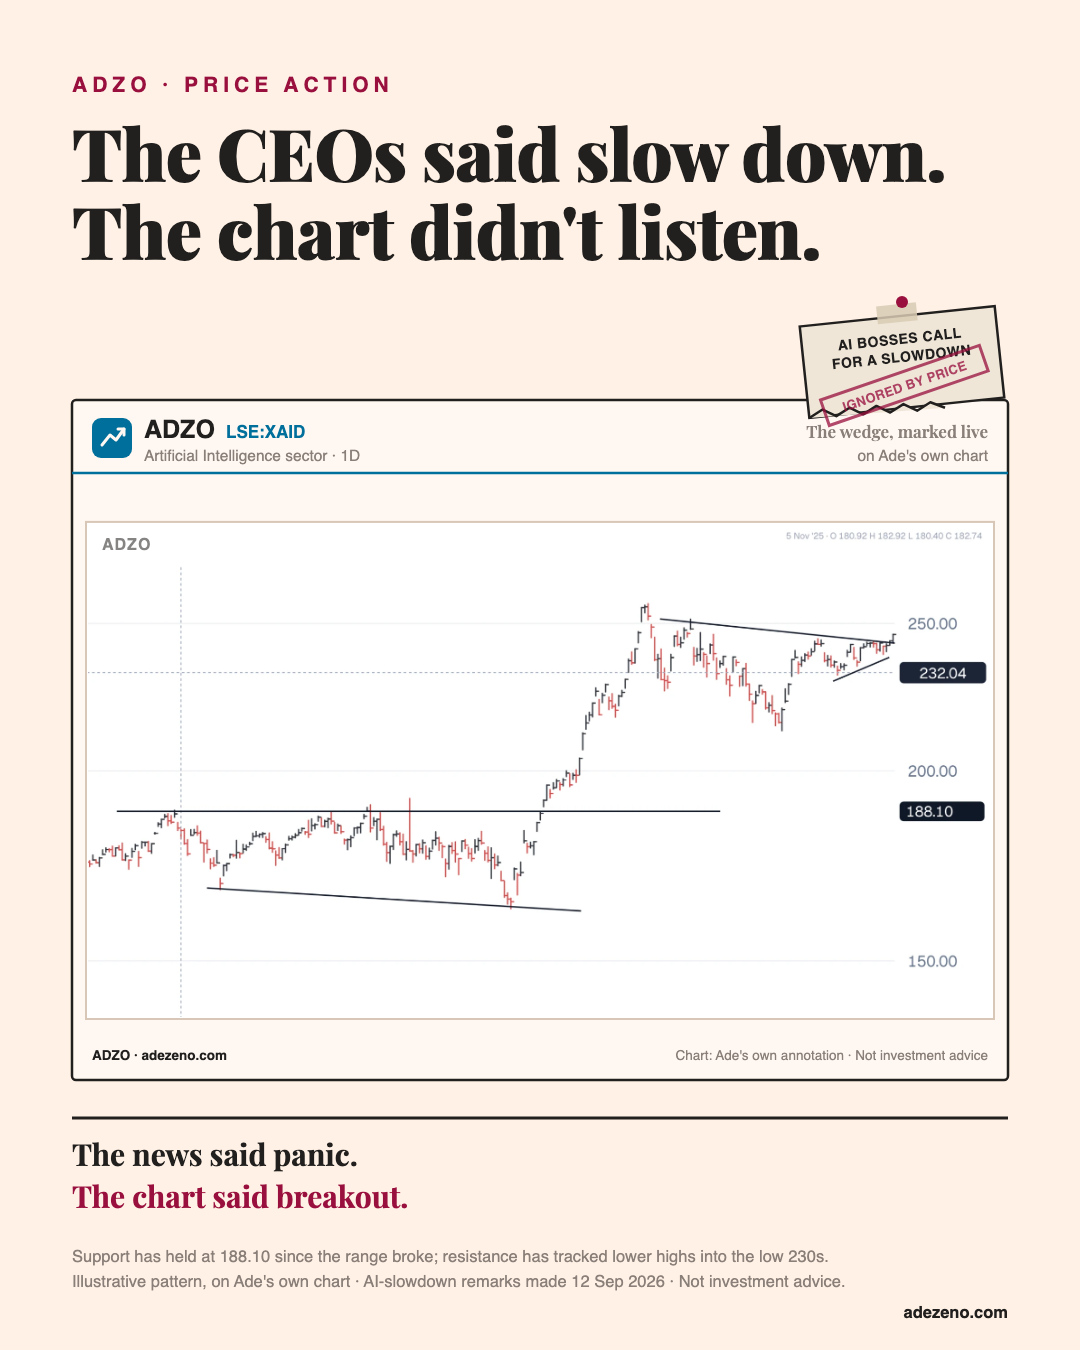
Forget the headline for a moment and look at the chart above — my own chart for the AI sector, marked up by hand. For months, price has been squeezing into a narrowing triangle. There is a falling ceiling on top (what traders call resistance: a level sellers keep showing up at, so every rally tops out a little lower than the last) sitting above a rising floor (support: a level buyers keep defending, so every dip holds a little higher than the last). Two lines squeezing together like that is usually called a wedge.
The floor under this squeeze has held firm at 188.10 since the range broke out of its earlier base. The ceiling has capped every rally since around June, in the low 230s. And on the chart above, price is pushing straight through that falling ceiling — regardless of what two chief executives said in public eleven days earlier.
This is not a prediction, and it is not a fresh data pull — it is a pattern read off my own chart, the same way I would read where a support level actually sits on Bitcoin. A squeeze like this does not tell you which way price will break; it just tells you the range is narrowing, and a bigger move usually follows once it does. The lesson is simpler than the chart: a scary headline tells you how people feel in that moment. Price tells you what they are actually doing with their money — and the two often disagree.
This reaction did not come from nowhere — it was the same week’s news I drew as a comic about an oil pipe, a Fed rate hike and an “AI Express” train hitting the brakes. And if a chart has ever talked you into seeing a story that was not really there, here is exactly how charts can lie without lying — which is why every line on my chart above is pinned to a real high or low, not drawn to make a point.
Send me your portfolio — I’ll show you the chart, not the headline → See the other storiesIllustration only, not a recommendation. This is one reading of one chart pattern, marked by hand on my own charting tool; markets can and do break in either direction, and a past pattern is not a guide to the future. Not financial advice. Adezeno is a licensed Unit Trust Consultant with Eastspring Investments Berhad, FiMM No. F01029300.